GIS based Monitoring and Analysis of Climate Change Impacts:
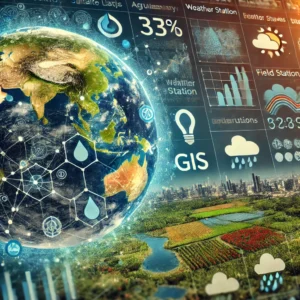
Geographic Information Systems (GIS) play a pivotal role in understanding, monitoring, and mitigating the impacts of climate change across various sectors, such as agriculture, forestry, urban planning, disaster management, and water resources. By integrating multiple data sources and enabling dynamic visualizations, GIS empowers decision-makers and researchers to assess how climate change affects ecosystems, infrastructure, and human populations.
- Integration of Diverse Data Sources
GIS enables the combination of data from various sources, such as:
- Satellite Imagery: Provides large-scale and real-time observations of land surface, atmospheric conditions, and ocean temperatures.
- Weather Stations: Collect localized data on temperature, precipitation, wind patterns, and humidity, which are essential for understanding micro-climate variations.
- Field Observations: Ground-based surveys and observations provide crucial data on biodiversity, land use changes, soil conditions, and water levels.
By integrating these data sets, GIS helps create comprehensive spatial models that show climate patterns and anomalies in fine detail.
- Dynamic Maps for Temporal Analysis
One of the key features of GIS is its ability to create dynamic maps that illustrate how certain parameters evolve over time. This temporal analysis is crucial for:
- Monitoring Trends: Maps generated through GIS can
 display changes in land use, vegetation cover, glacial melting, or sea-level rise over a specific period.
 - Predictive Modelling: GIS can simulate potential future scenarios by inputting climate models and forecasting how different climate policies or interventions might influence outcomes.
- Real-time Updates: In areas prone to disasters, GIS enables real-time monitoring of floods, wildfires, and storms, assisting in early warning systems and immediate response planning.
- Sector-Specific Applications of GIS in Climate Monitoring
GIS provides actionable insights tailored to the needs of specific sectors:
- Agriculture: By analysing temperature shifts, soil moisture, and rainfall patterns, GIS helps in identifying areas vulnerable to droughts or floods, enabling farmers to adopt climate-smart practices.
- Forestry: GIS tracks deforestation, forest degradation, and biodiversity loss, offering insights into carbon sequestration efforts and the health of forest ecosystems.
- Urban Planning: As cities grapple with rising temperatures and increased flooding, GIS assists urban planners in designing infrastructure resilient to climate change by mapping flood zones, heat islands, and energy consumption trends.
- Water Resource Management: GIS helps monitor changes in river flow, groundwater levels, and precipitation, which is crucial for water management and flood mitigation.
- Biodiversity Conservation: GIS enables tracking of species migration patterns, habitat destruction, and the effect of climate change on biodiversity hotspots.
- Spatial Analysis and Impact Assessment
GIS supports spatial analysis, which allows researchers to identify:
- Vulnerable Areas: Through mapping, GIS identifies areas most susceptible to climate-related hazards, such as coastal zones at risk of sea-level rise or regions experiencing desertification.
- Impacts on Communities: By combining demographic data with climate models, GIS can reveal how different populations (e.g., those in low-income or marginalized communities) will be affected by climate change.
- Cross-Sectoral Impacts: GIS allows for the examination of how climate change affects multiple sectors simultaneously, such as the combined effects of drought on agriculture, water resources, and public health.
- Improved Decision-Making and Policy Formulation
GIS provides a powerful tool for policy makers by delivering data-driven insights:
- Climate Adaptation Strategies: Governments can use GIS to plan and implement climate adaptation strategies, such as relocating vulnerable communities or investing in resilient infrastructure.
- Resource Allocation: GIS maps can help prioritize regions for resource allocation, ensuring that the most vulnerable areas receive timely support.
- Environmental Protection Policies: GIS can help monitor protected areas and assess the effectiveness of conservation efforts, guiding future policies.
- GIS and Village-Level Mapping with GIS Tools
- GIS (Geographic Information Systems) facilitates the monitoring and analysis of climate change impacts across different sectors. By combining various data sources such as satellite imagery, weather stations, and field observations, GIS enables the creation of dynamic maps that illustrate changes over time. These maps help visualize trends, patterns, and potential risks associated with climate change, aiding in decision-making for sustainable solutions.
- In rural and village-level mapping, tools of ArcGIS Pro, QGIS, MapInfo, etc. will provide valuable insights into land use, water resources, and agricultural practices. By implementing GIS at the village level, we can monitor environmental conditions, manage natural resources more efficiently, and support rural development.


